Software Prefetcher
Profile-guided Optimization(PGO) Overview
A. Overall Process
Step 1: Running & Profiling
Step 2: Analysis.
The profiling and tracing data as well as the unmodified binaries are then fed into a tool
Step 3: Injection
B. Profiling & Tracing Tools
| tools | -- |
|---|---|
| VTune | instruction mix |
| PMU counters | instruction mix |
| PEBS (precise event-based sampling) | execution frequency, AMAT, |
| LBR (last branch record) | |
| PT (processor trace) | execution frequency |
C. Representative work
- [MICRO'22 Best Paper] Whisper: Profile-Guided Branch Misprediction Elimination for Data Center Applications
- [ISCA'22] Thermometer: Profile-Guided BTB Replacement for Data Center Applications
- [EuroSys'22] APT-GET: Profile-Guided Timely Software Prefetching
- [ASPLOS'22] CRISP: Critical Slice Prefetching
- [MICRO'21] Twig: Profile-Guided BTB Prefetching for Data Center Applications
- [ISCA'21] Ripple: profile-guided instruction cache replacement for data center applications
- [MICRO'20] I-SPY: Context-Driven Conditional Instruction Prefetching with Coalescing
- [ASPLOS'20] Classifying Memory Access Patterns for Prefetching
- [ISCA'19] AsmDB: understanding and mitigating front-end stalls in warehouse-scale computers
- [CGO'19] BOLT: A Practical Binary Optimizer for Data Centers and Beyond
- [CGO'16] AutoFDO: automatic feedback-directed optimization for warehouse-scale applications
Classifying Memory Access Patterns
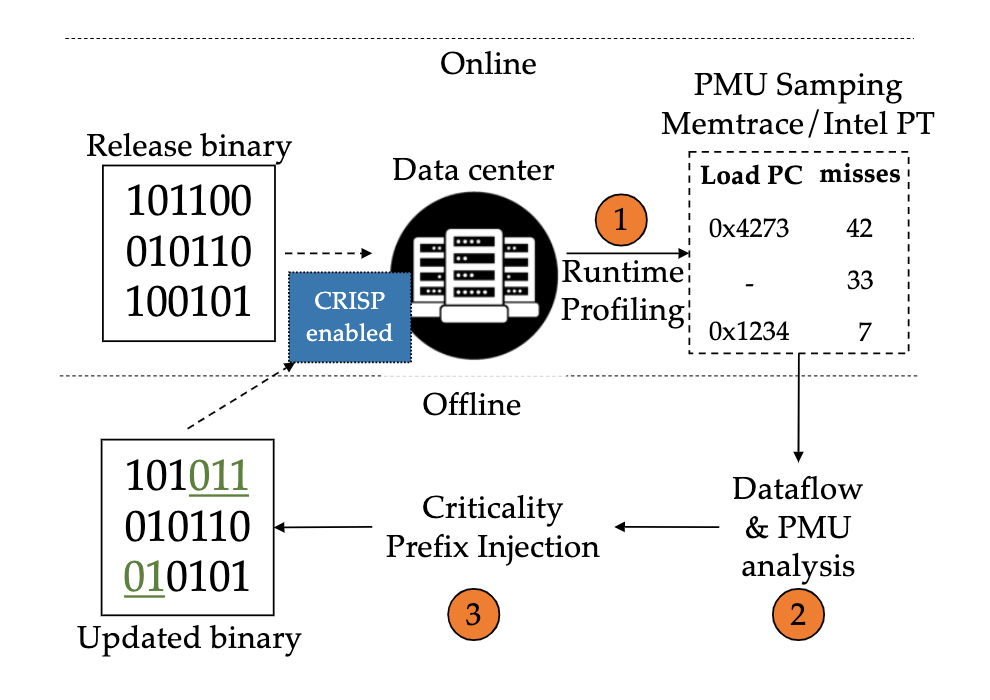
This approach executes the target binracy once to obtain execution traces and miss profiles, performs dataflow analysis, and finally injects prefetches into a new binary.
Memory Access Pattern -- The Recurrence Relation
is a memory address represents the nth execution of a particular load instruction is an arbitrary function. The complexity of determines the capabilities a prefetcher requires to predict and prefetch a certain future cache miss.
| Pattern | Recurrence relation | Example | Note |
|---|---|---|---|
| Constant | *ptr | ||
| Delta | streaming, array traversal | d=stride | |
| Pointer Chase | next=current->next | load addr is derived from the value of prev load | |
| Indirect Delta | *(M[i]) | ||
| Indirect Index | M[N[i]] | c=base addr of M, d=stride | |
| Constant plus offset reference | Linked list traversal |
To formalize prefetch patterns, define prefetch kernel:
For a given load instruction and its function to compute the next address,
can be expressed as a prefetch kernel which consists of a number of data sources and operations on those sources which generate the delinquent load address.
- Data source types
- constants
- registers
- memory locations
- Operations
- instruction or micro-op specified by tehe ISA
Extract Prefetch Kernel
| Machine Classification | Corresponding Pattern |
|---|---|
| Constant | Constant |
| Add | Delta |
| Add, Multiply | Complex |
| Load, Add | Linked List, Indirect Index, ... |
| Load, Add, Multiply | Complex |
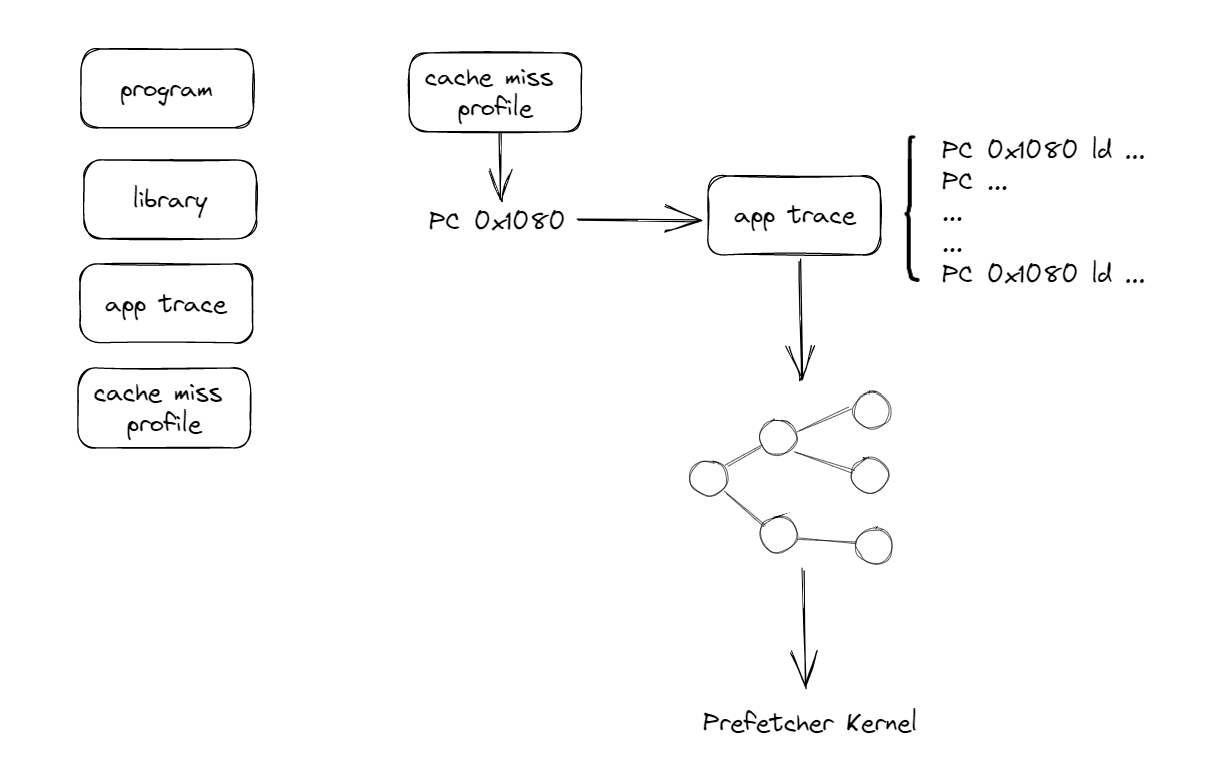
Preparation
- program & library binaries
- application trace: PC as well as the memory addr of all load and store insts
- cache miss profile: a ranked list of PCs that cause cache misses
Process
- Dataflow Analysis
- Locate the execution history window (from miss PC back to the same PC)
- Build data dependencies
- Compaction
- store-load bypassing
- arithmetic distribution and compaction
- assignment and zero pruning
Analysis
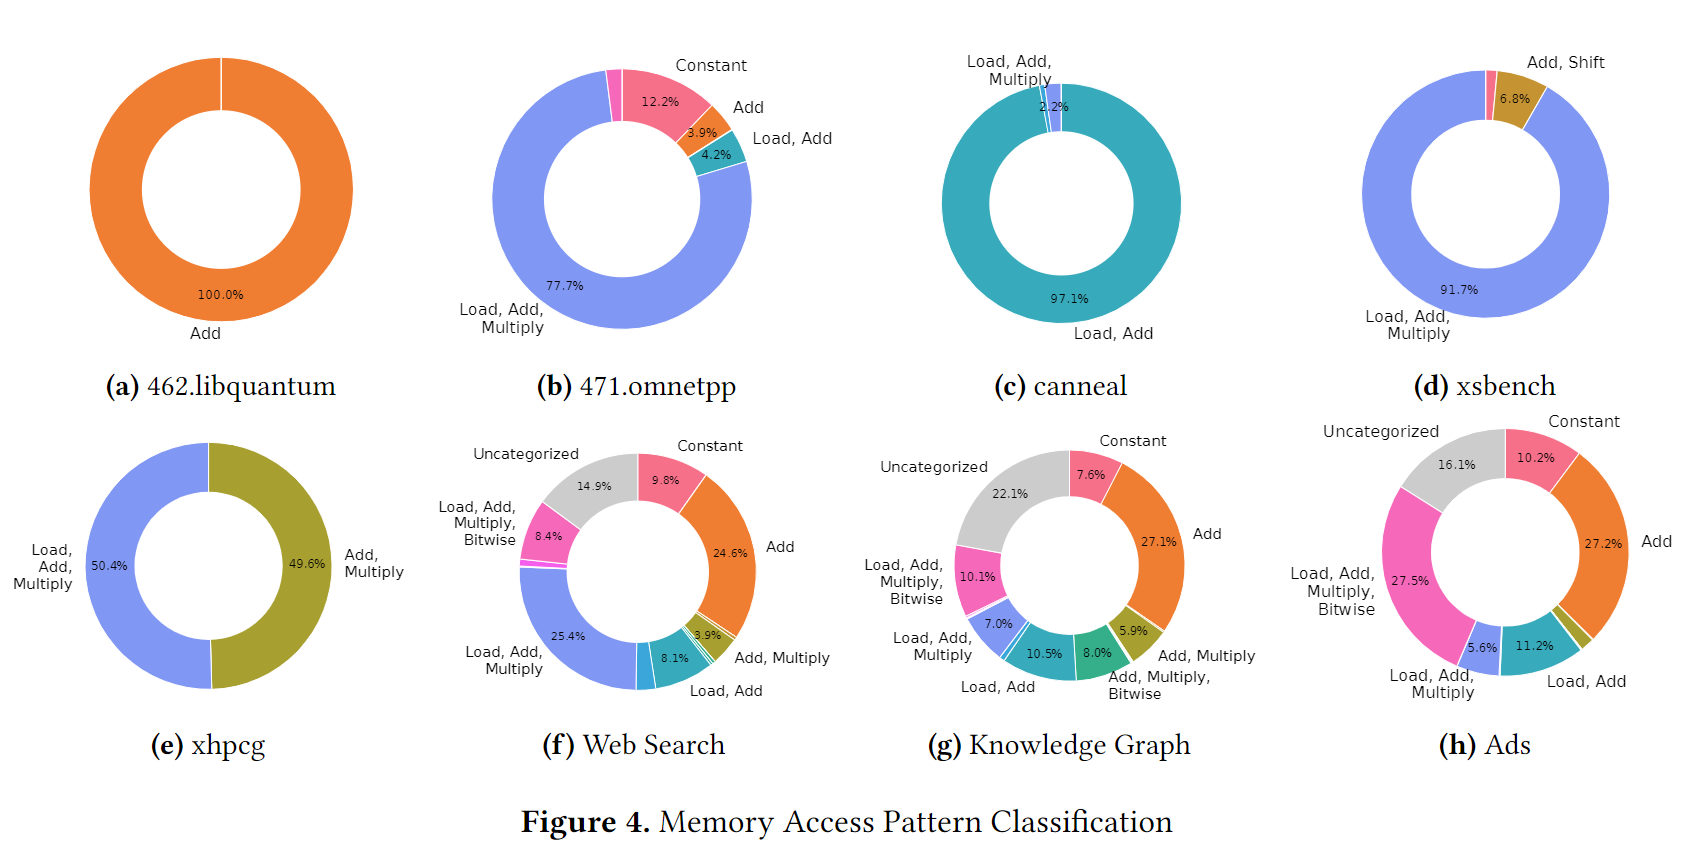
Findings:
- Indirection使得spatial prefetcher效果变差
- 很大一部分程序虽然没有Indirection, 但是reuse distance很大
- simple kernel可能也需要复杂计算
- pattern数量很多
CRISP: Critical Slice Prefetching
Overview
Motivation
Reordering instructions --> critical first
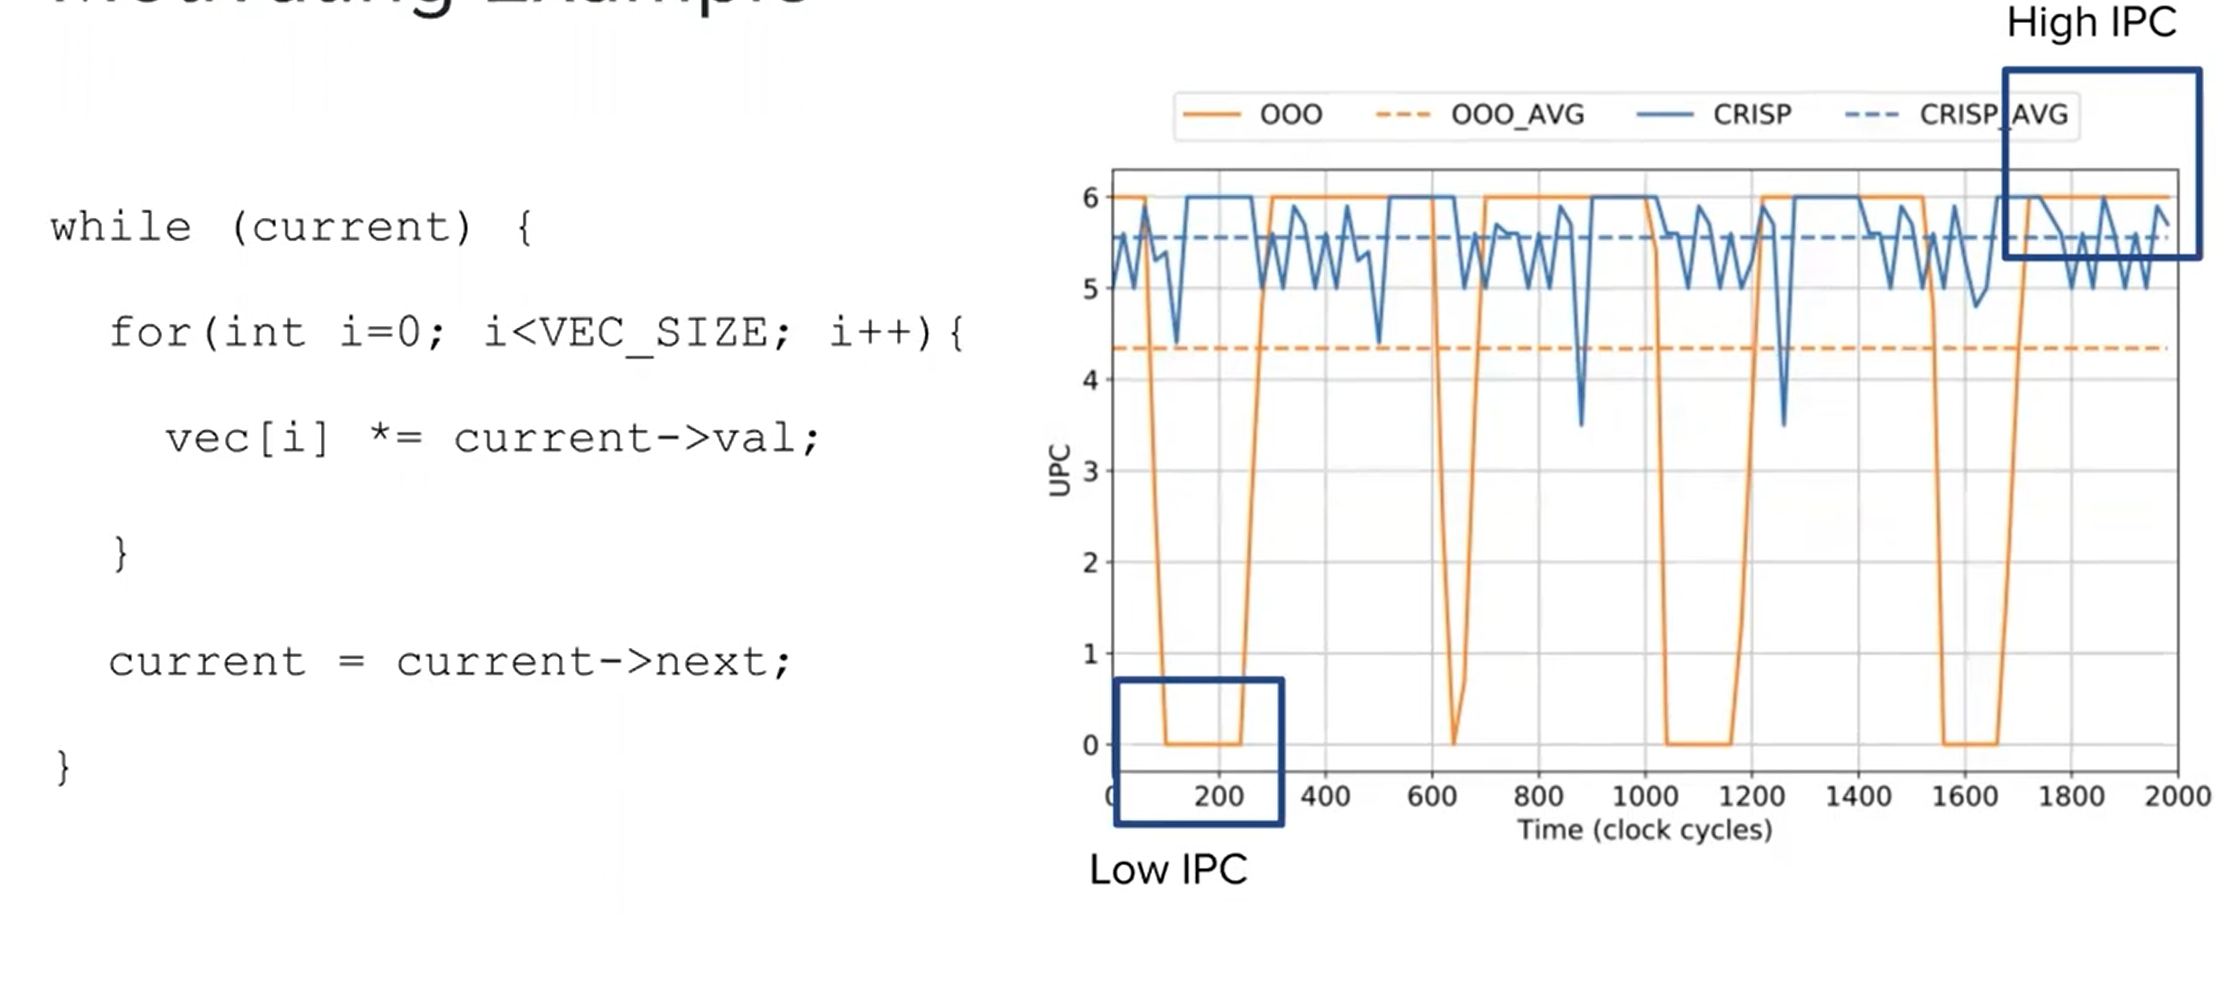
What is CRISP:
CRISP is a a lightweight mechanism to hide the high latency of irregular memory access patterns by leveraging criticality-based scheduling.
CRISP executes delinquent loads and their load slices as early as possible, hiding a significant fraction of their latency. Furthermore, we observe that the latency induced by branch mispredictions and other high latency instructions can be hidden with a similar approach.
Two Tasks:
- Task1: Identifying cirtical instruction. CRISP identifies high-latency load instructions that frequently induce pipeline stalls due to cache misses and tracks their load-address-generating instructions (slices).
- Task2: Tagging and prioritizing critical instruction's execution. By tagging these instructions as critical and prioritizing their execution, the instruction scheduler can hide a large fraction of the memory access latency, improve memory-level parallelism (MLP) and overall performance.
Task 1: Instruction Criticality
Step1: Determining Delinquent Loads
A. What is a critical load
Define: A load is critical if
- its LLC miss rate is higher than a threshold (e.g. 20%)
- its memory addr cannot be easily predicted by the hardware prefetcher
- the number of independent instructions behind the load in the sequential instruction stream is small
There are other factors, e.g.
- the load's execution ratio over other loads in the program
- the LLC miss rate of the load
- the pipeline stalls induced by the load
- the baseline IPC and instruction mix of a program
- the MLP of the program at the time where the load occurs
- the time a load becomes ready to be scheduled, determined by its dependency on other high latency instructions
B. How to obtain these info
How to collect thses info
- IPC: directly measured
- instruction mix: VTune or PMU counters
- the execution frequency of a specific load: Precise event-based sampling (PEBS), Processor trace (PT)
- A load' average memory access time: PEBS
- the pipeline stalls induced by a load and MLP: observing precise back-end stalls and load queue occupancy
Step2a: Load Slice Extraction
- After obtaining a trace, we perform load slice extraction by iterating through the trace until one of the delinquent load instructions (see Section 3.2) is found
- traverse in reverse order
算法上用了一个队列的形式。我感觉相当于一个二叉树的层序遍历?
- flag all load slice instructions as critical by prepending the new 'critical' instruction prefix duing the FDO pass.
Step2b: Branch Slice Extraction
For loops that contain hard-to-predict branches, the execution time of a loop iteration is determined to a large degree by the time required to resolve the branch outcom.
--> Prioritize hard-to-predict branch slices
Step3: Inject into binrary
Rewrite the compiled assembly code adding the new instruction prefix to every critical instruction using post-link-time compilation.
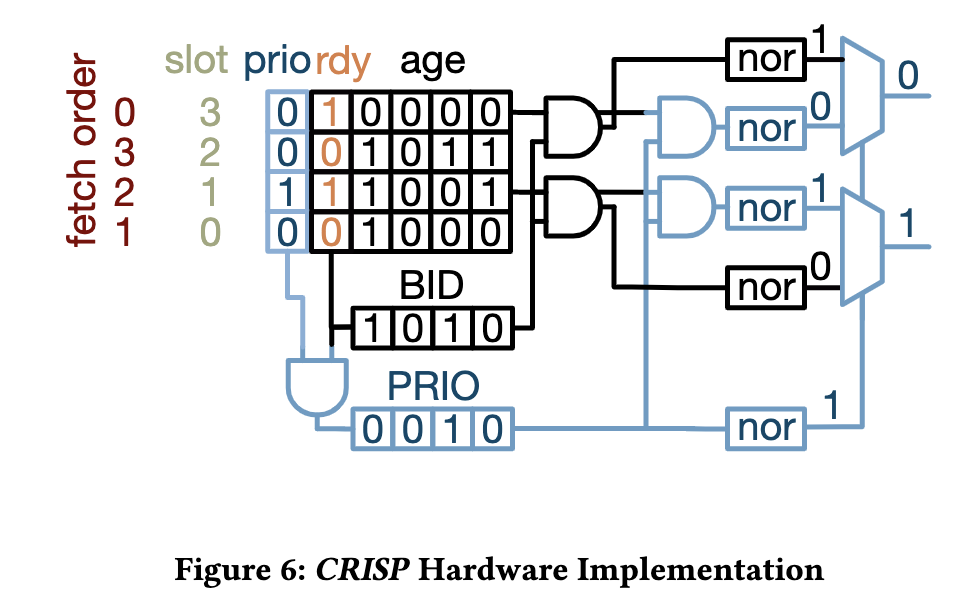
Task 2: Hardware Scheduling
- Extend the instruction decoder to interpret the new latency-critical instruction prerfix and tag all critical instructions as they progress through the CPU pipeline
- Extend the IQ scheduler to priotitize these critical instructions.
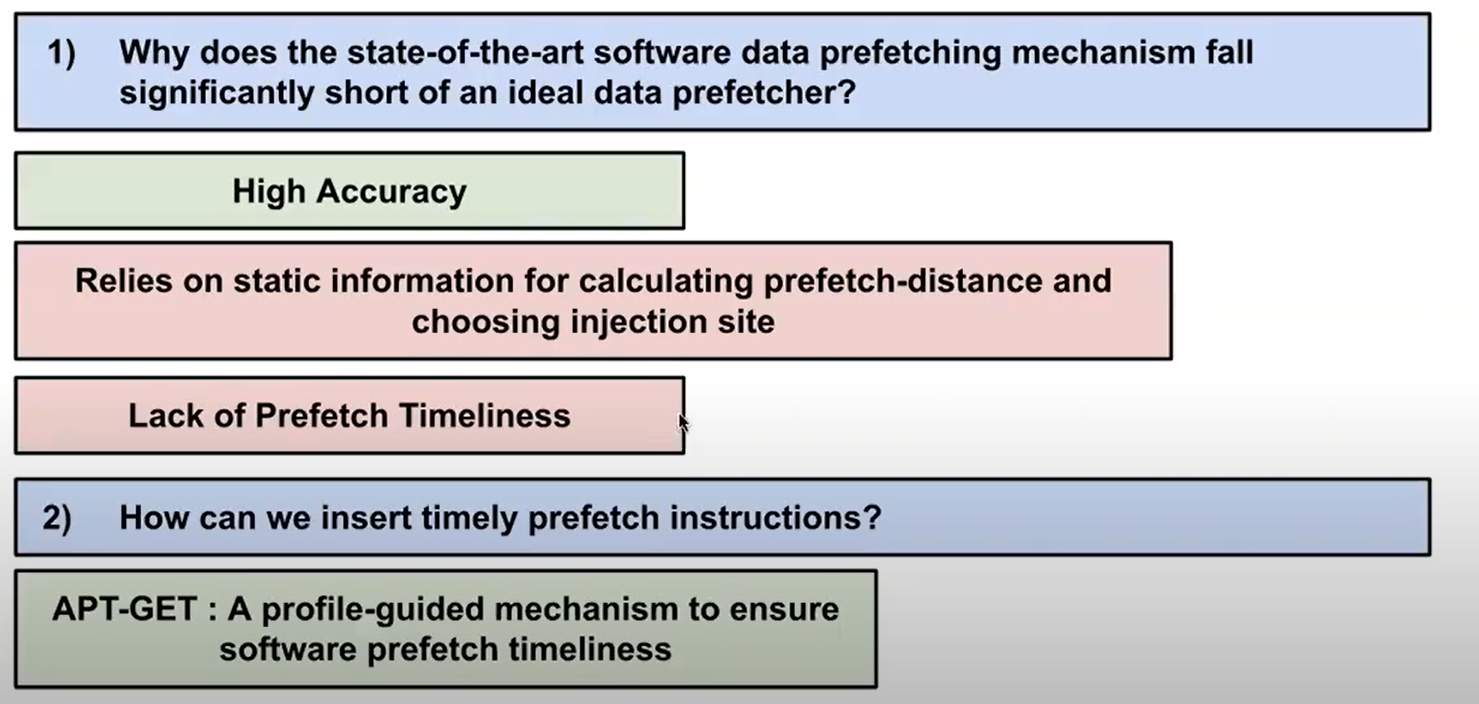
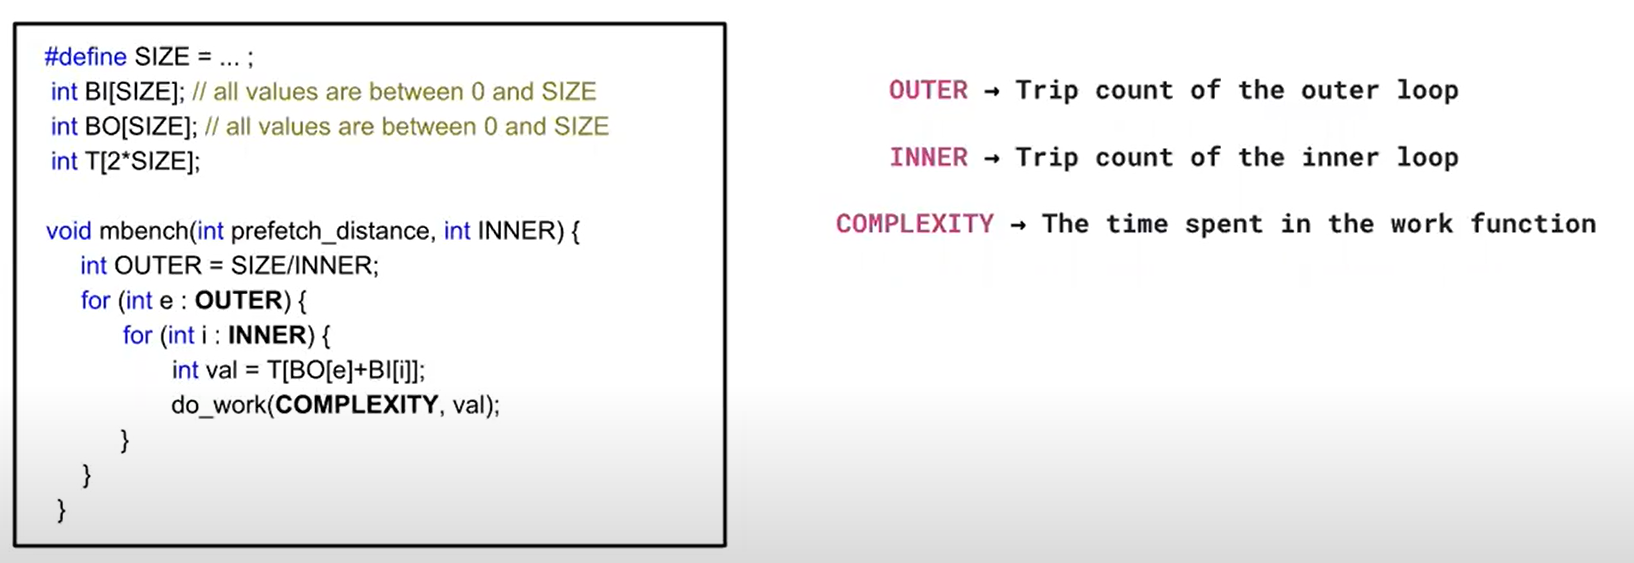
APT-GET: Profile-Guided Timely Software Prefetching
Overview
自动化的过程
- 用perf record找到cache miss多的loads和他们的basic block
- 找到对应的LBR profile
- 计算prefetch distance和prefetch injection site
- 输入LLVM使用
Background
hwpf无法检测complex pattern比如indirect mem access, s现有的sw prefetcher通过static信息可能可以有比较好的accuracy和coverage, 但是由于缺少dynamic execution info 比如execution time, 很难做到timely。这篇文章认为timely prefetch有两个重要的点:prefetch distance和prefetch injection site, 所以通过profile-guided的方法获取了一些dynamic info来指导timely prefetch 途径
Motivation
!
Step1: Profiling
- Cache miss profile --> 收集比较关心的demand loads的信息,比如这条load的hit/miss ratio
- LBR (Last Branch Record) samples --> 可以得到包含这条load指令的loop的trip count, 单次loop的执行时间
收集这些信息后,就可以分析知道同一条load的两次执行之间的时间(loop latency or execution time),以便得到timely prefetch
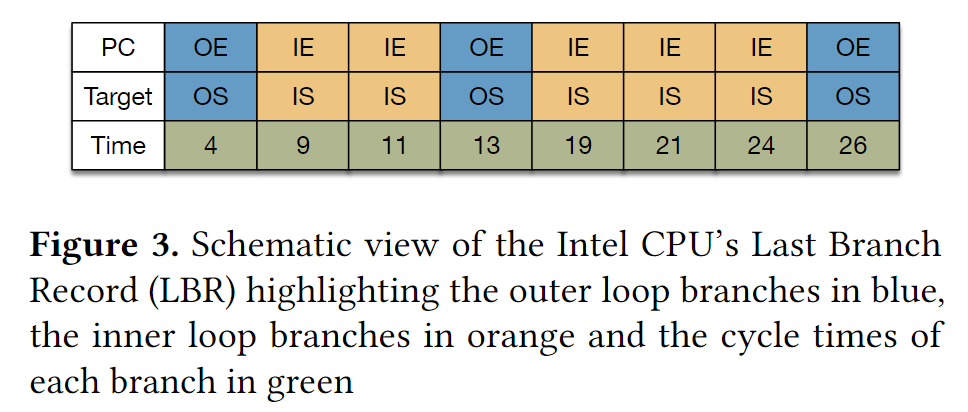
文章里面用到Intel CPU上的Last Branch Record (LBR) 如上图所示
每个LBR有一个PC,记录这里发生了一个taken branch;有一个Target, 记录跳转地址;有一个branch执行的时间。
LBR是一个buffer, 其中存了last 32 basic blocks (BBL) executed by the CPU。
BBL是两个taken branch之间连续执行的一段指令
Step2: Analysis
Overview
Loop latency包含两部分的执行时间信息
- instruction component (IC)
- includes all (non-load) instructions implementing the loop
- IC_latency取决于指令数量和指令的控制流依赖,基本上是常量
- memory component (MC)
- includes the loads causing frequent cache misses
- MC_latency取决于内存状态,会有很大变化
IC_latency和MC_latency得到之后,可以通过如下公式计算prefetch_distance。在这个distance下,prefetch可以hide memory latency
接下来就是怎么去得到IC_latency和MC_latency
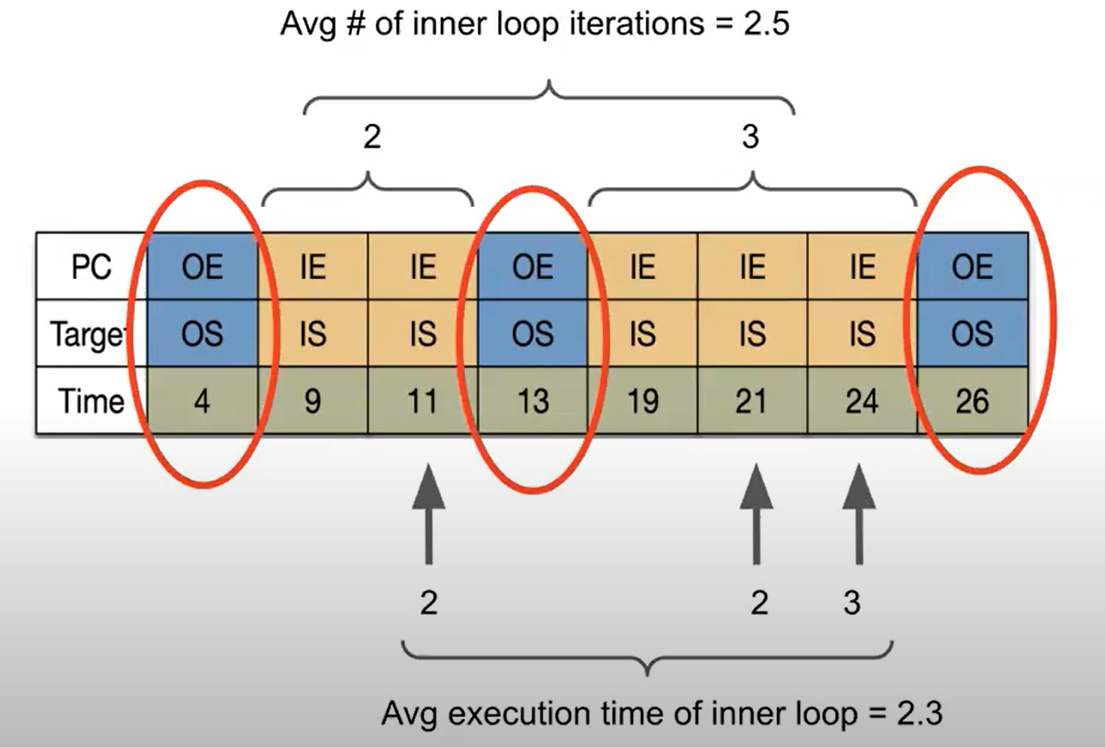
A. 计算loop execution time & loop trip count
- loop execution time计算:finding two instances of the same branch PC implementing a loop and subtracting their cycle counts, we can compute the execution time of a loop iteration
- loop trip count计算:In the case of a nested loop, if we know the branch PC corresponding to the outer loop and the branch PC corresponding to the inner loop, we can count the number of inner branch PCs within two outer branch PCs in the LBR to compute the number of inner loop iterations.
B. Determining the Optimal Prefetch Distance
得到loop execution time之后还是得不到IC_latency, MC_latency
为此,这篇文章做了loop execution time的latency distribution
- for all LBR samples that contain at least two instances of the BBL containing the delinquent load, measure the loop execution time by subtracting the cycle counts of the two subsequent branches
- analyze the latency distribution of the loop's execution time to predict the latency in the case that the load is served from the L1 or L2 cache
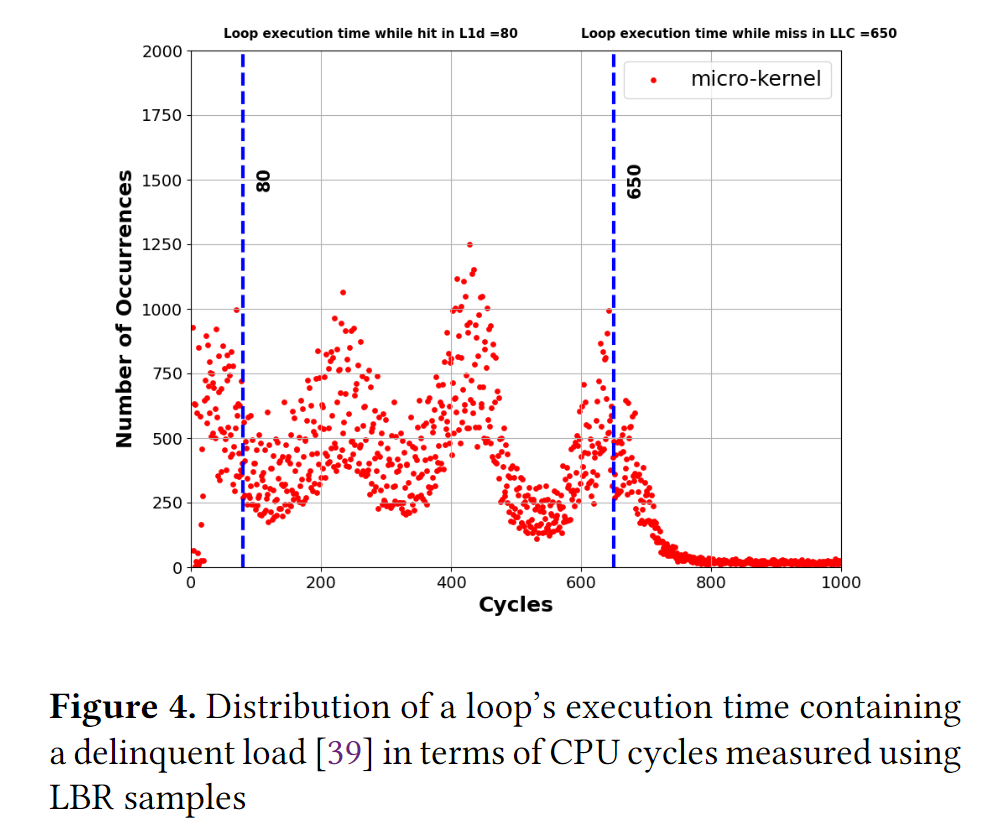
这个一个distribution图,显示了4个峰:80, 230, 400, 650 cycles; 对应了serve from L1, L2, LLC, DRAM
计算可得IC_latency=80 cycles, MC_latency=650-IC_latency=570 cycles
最后prefetch_distance=570/80~7
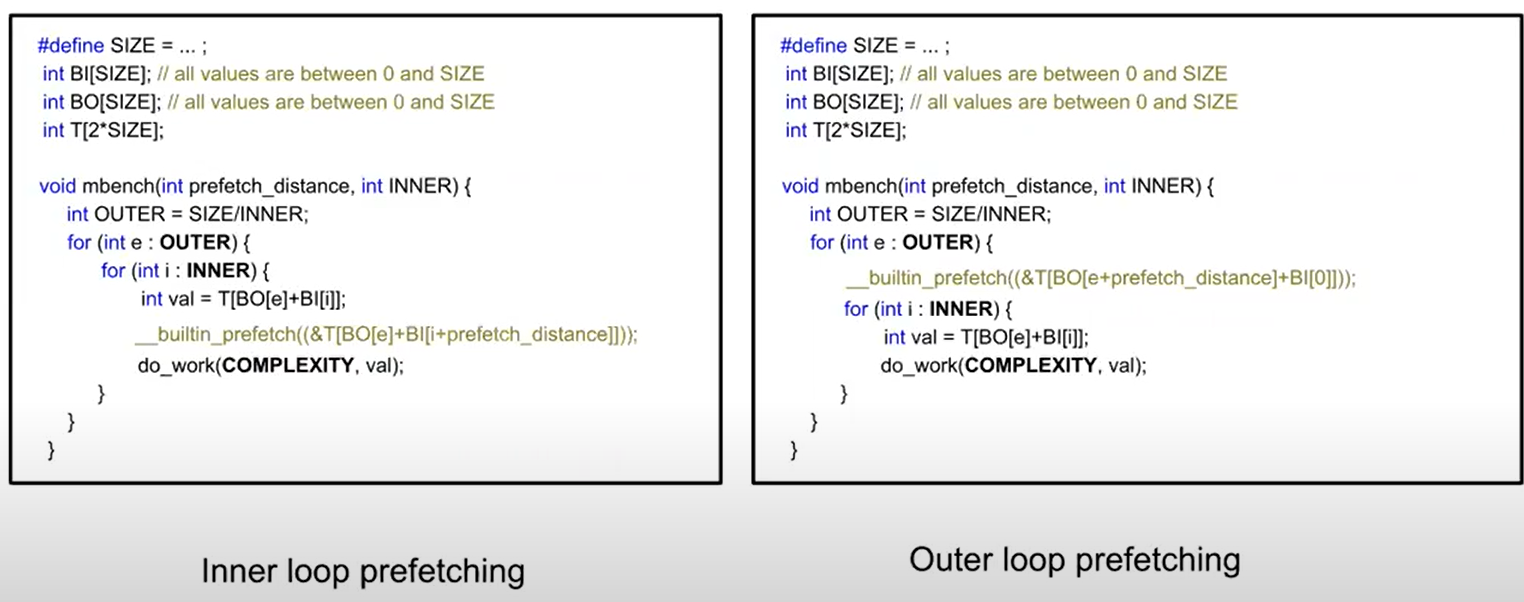
Step3: Injection -- Finding the Optimal Prefetch Injection Site
inject在outerloop还是innerloop, 由以下公式选择,如果以下成立,就inject在outerloop
其中k代表的是???
如果决定inject在outerloop, 则需要重新根据outer loop execution latency计算prefetch distance
Resources
**### Disclosure of H/W prefetcher control on some Intel processors
| Prefetcher | Bit# in MSR 0x1A4 | Description |
|---|---|---|
| L2 hardware prefetcher | 0 | Fetches additional lines of code or data into the L2 cache |
| L2 adjacent cache line prefetcher | 1 | Fetches the cache line that comprises a cache line pair (128 bytes) |
| DCU prefetcher | 2 | Fetches the next cache line into L1-D cache |
| DCU IP prefetcher | 3 | Uses sequential load history (based on Instruction Pointer of previous loads) to determine whether to prefetch additional lines |
| If any of the above bits are set to 1 on a core, then that particular prefetcher on that core is disabled. Clearing that bit (setting it to 0) will enable the corresponding prefetcher. |
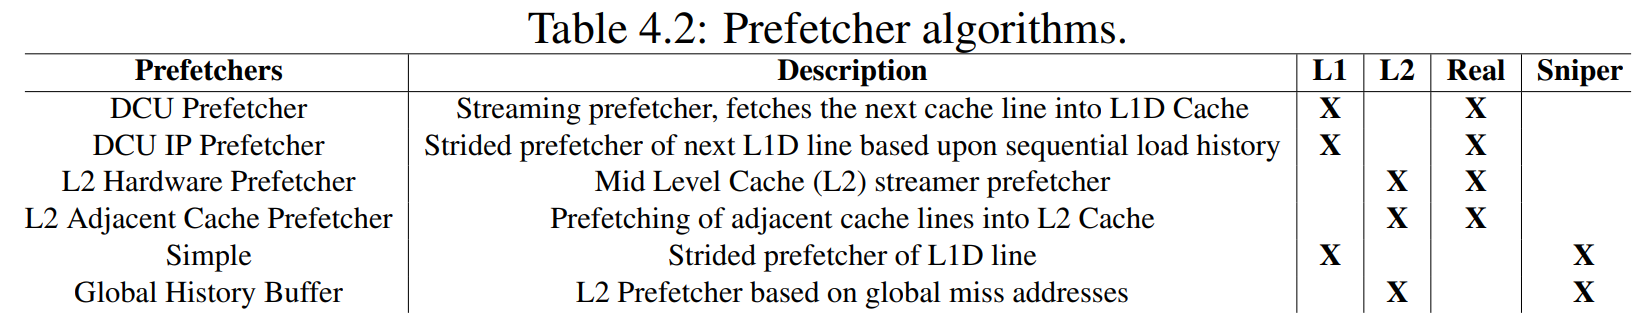
- The algorithms found in the L1 cache hardware are the Data Cache Unit (DCU) Prefetcher (INTEL, 2019) and the DCU IP Prefetcher (INTEL, 2019). The DCU Prefetcher, also known as the streaming prefetcher, is triggered by an ascending access to very recently loaded data. The processor assumes that this access is part of a streaming algorithm and automatically fetches the next line. The DCU IP Prefetcher keeps track of individual load instructions (based on their instruction pointer value). If a load instruction is detected to have a regular stride, then a prefetch is sent to the next address which is the sum of the current address and the stride.
- The L2 Hardware Prefetcher (INTEL, 2019) and the L2 Adjacent Cache Prefetcher (INTEL, 2019) are the prefetcher algorithms found in the real machine L2 cache. The L2 Hardware Prefetcher monitors read requests from the L1 cache for ascending and descending sequences of addresses. Monitored read requests include L1 data cache requests initiated by load and store operations and also by the L1 prefetchers, and L1 instruction cache requests for code fetch. When a forward or backward stream of requests is detected, the anticipated cache lines are prefetched. This prefetcher may issue two prefetch requests on every L2 lookup and run up to 20 lines ahead of the load request. The L2 Adjacent Cache Prefetcher fetches two 64-byte cache lines into a 128-byte sector instead of only one, regardless of whether the additional cache line has been requested or not.